Executions & traces
Find an execution, watch it live, and explore its full step-by-step trace.
An execution is one dispatch of an agent or workflow. It records the input it was given, the output (or error) it produced, how long it took, how many tokens it used, what triggered it, and which version ran. Because an execution captures every step it took, an execution is its trace.
The executions list
The executions list shows executions newest-first, with:
- Status — a colored badge: completed, running, failed, or cancelled.
- A reference identifying the execution, and the agent or workflow it ran, with its step count.
- Trigger — what started it (scheduled, manual, test).
- Duration and started time.
You can filter by status (All, Running, Completed, Failed, Cancelled — each with
a count) and search by name or id to find a specific execution. Ids are typed by
what was dispatched — workflow_execution_<hex> for a workflow,
agent_execution_<hex> for an agent — and they're the same ids the API returns.
Select any execution to open its detail view.
Watching an execution live
Open an execution that's still going and you'll see it happen in real time:
- a Running · live indicator,
- each tool call appearing as it's invoked, and marked done when its result returns,
- the agent's reasoning and output streaming in as it's generated,
- and any error shown immediately if it fails midway.
When the execution finishes, the view switches automatically to the full trace below.
Exploring a completed trace
A finished execution opens as a two-pane trace explorer.
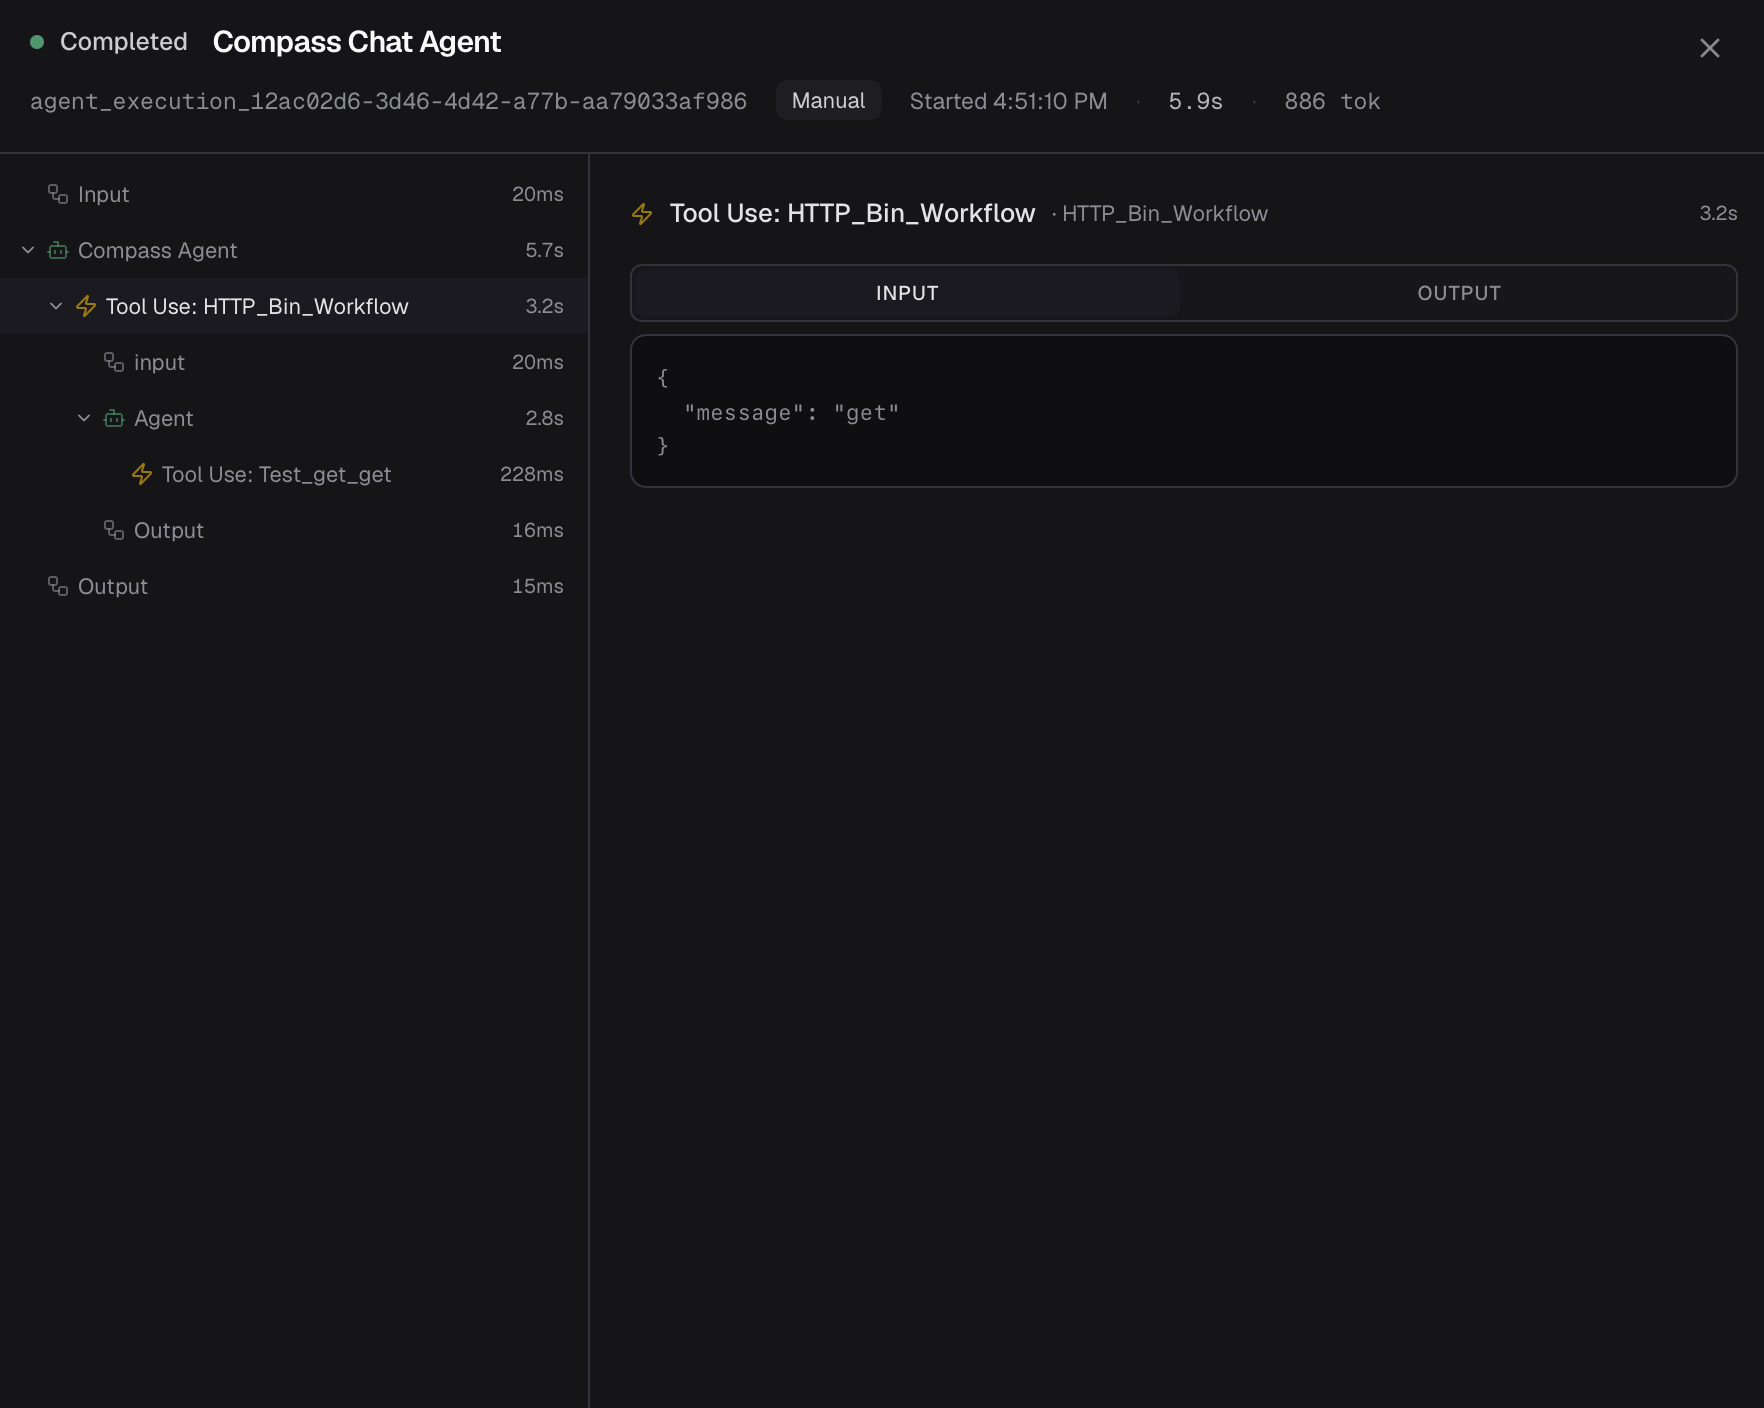
On the left is the step tree: every node that ran — agents, integrations, and the tool calls an agent made — indented to show nesting. When a step called a sub-workflow or another agent, you can expand it to see that child execution's own steps inline, all the way down. Failed steps are marked in red.
On the right is the detail for whatever step you select:
- For a node: its name, type, duration, start time, token count (and the model, for an agent), with Input and Output tabs showing the data.
- For a tool call: its name and duration, with Args and Result tabs.
- Any error is shown here too.
Together they let you follow exactly what happened, in what order, with the data at each step — the primary way to understand and debug an execution.
The execution header
The detail view's header carries the execution's essentials at a glance: status, its reference id, what triggered it, when it started, how long it took, and total tokens used.